What is it?
The BCG Growth Matrix, also known as the Boston Consulting Group (BCG) Matrix, is a portfolio management framework used by companies to prioritize their different business units or products. It was developed by the Boston Consulting Group and is based on two key factors:
- Market Growth Rate: This is represented on the vertical axis of the matrix. It indicates the rate at which the market for a particular product or business unit is growing.
- Relative Market Share: This is represented on the horizontal axis of the matrix. It reflects the market share of a product or business unit in relation to its competitors.
How does it work?
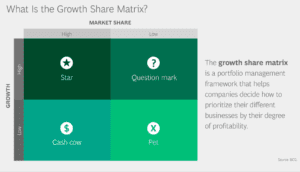
The BCG Matrix categorizes products or business units into four quadrants:
- Stars: Products with high market share in a high-growth market. Companies typically invest heavily in these to maintain or expand their market dominance.
- Cash Cows: Products with high market share in a low-growth market. These generate consistent cash flow and are often used to support other business units.
- Question Marks (Problem Children): Products with low market share in a high-growth market. Companies need to decide whether to invest in them to turn them into stars or phase them out.
- Dogs: Products with low market share in a low-growth market. These typically don’t generate much profit and may be candidates for divestment.
The BCG Matrix is a valuable tool for strategic planning, helping companies allocate resources, make investment decisions, and manage their portfolio of products or business units effectively. It enables businesses to balance risk and reward in their overall strategy.
On the BCG website (link below) the provide the following scenarios:
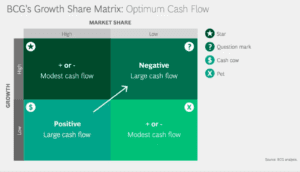
The growth share matrix was built on the logic that market leadership results in sustainable superior returns. Ultimately, the market leader obtains a self-reinforcing cost advantage that competitors find difficult to replicate. These high growth rates then signal which markets have the most growth potential.
The matrix reveals two factors that companies should consider when deciding where to invest—company competitiveness, and market attractiveness—with relative market share and growth rate as the underlying drivers of these factors.
Each of the four quadrants represents a specific combination of relative market share, and growth:
- Low Growth, High Share. Companies should milk these “cash cows” for cash to reinvest.
- High Growth, High Share. Companies should significantly invest in these “stars” as they have high future potential.
- High Growth, Low Share. Companies should invest in or discard these “question marks,” depending on their chances of becoming stars.
- Low Share, Low Growth. Companies should liquidate, divest, or reposition these “pets.”
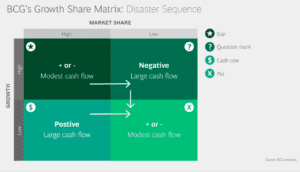
As can be seen, product value depends entirely on whether or not a company is able to obtain a leading share of its market before growth slows. All products will eventually become either cash cows or pets. Pets are unnecessary; they are evidence of failure to either obtain a leadership position or to get out and cut the losses.


References
https://www.bcg.com/about/overview/our-history/growth-share-matrix